Introduction to helpr
helpr.RmdThe helpr package contains numerous helpers, wrappers,
and utilities used throughout the my analysis suite. It intentionally
favors base R over higher level tidyverse to minimize imports.
The goal is to provide an alternative gain in functionality without the
cost of additional imports/dependencies.
Useful functions in helpr
- File-system: See
?filesystem - Signal UI: See
?signal - Symbols: See
?sybml - Strings:
- Handlers:
-
liter():- List iteration, similar to
purrr::imap()but simpler
- List iteration, similar to
- Calculations:
-
calc_ccc(): Calculate Lin’s Concordance Correlation Coefficient for two vectors of numeric data. -
calc_ss(): Calculate the sum of squared errors: for numeric data.
-
- Logic Tests:
-
rep_lgl(): Are all the elements of a vector identical? -
is_monotonic(): Are the numerical elements of a vector monotonically increasing or decreasing? -
is_logspace(): Does a given object (vector,data.frame,tbl_df) appear to be in log-space? Note: this function is biased to proteomic data and should not be expected to be accurate for other applications out-of-the-box.
-
-
cross_tab()- Create a contingency table of counts generated by cross-classifying.
-
diff_vecs()- Generate all diffs of two vectors of (typically character) data.
Returns both sided
setdiff,unionandintersect.
- Generate all diffs of two vectors of (typically character) data.
Returns both sided
-
dater()- Generate a standardized data in (by default)
YYYY-MM-DD.
- Generate a standardized data in (by default)
Examples
cross_tab()
You do not need to “quote” the passed arguments, unquoted strings are
fine and are parsed by NSE (non-standard evaluation). The
... can take on either one or two column names:
# 1 factor
cross_tab(mtcars, cyl)      # unquoted string
#> cyl
#>   4   6   8 Sum
#>  11   7  14  32

cross_tab(mtcars, "cyl")    # quoted string
#> cyl
#>   4   6   8 Sum
#>  11   7  14  32

var <- "cyl"
cross_tab(mtcars, var)      # external variable
#> cyl
#>   4   6   8 Sum
#>  11   7  14  32

cross_tab(mtcars, cyl, gear)      # 2 factors
#>      gear
#> cyl    3  4  5 Sum
#>   4    1  8  2  11
#>   6    2  4  1   7
#>   8   12  0  2  14
#>   Sum 15 12  5  32

cross_tab(mtcars, cyl, gear, am)  # 3 factors
#> , , am = 0
#>
#>      gear
#> cyl    3  4  5 Sum
#>   4    1  2  0   3
#>   6    2  2  0   4
#>   8   12  0  0  12
#>   Sum 15  4  0  19
#>
#> , , am = 1
#>
#>      gear
#> cyl    3  4  5 Sum
#>   4    0  6  2   8
#>   6    0  2  1   3
#>   8    0  0  2   2
#>   Sum  0  8  5  13
#>
#> , , am = Sum
#>
#>      gear
#> cyl    3  4  5 Sum
#>   4    1  8  2  11
#>   6    2  4  1   7
#>   8   12  0  2  14
#>   Sum 15 12  5  32
calc_ccc()
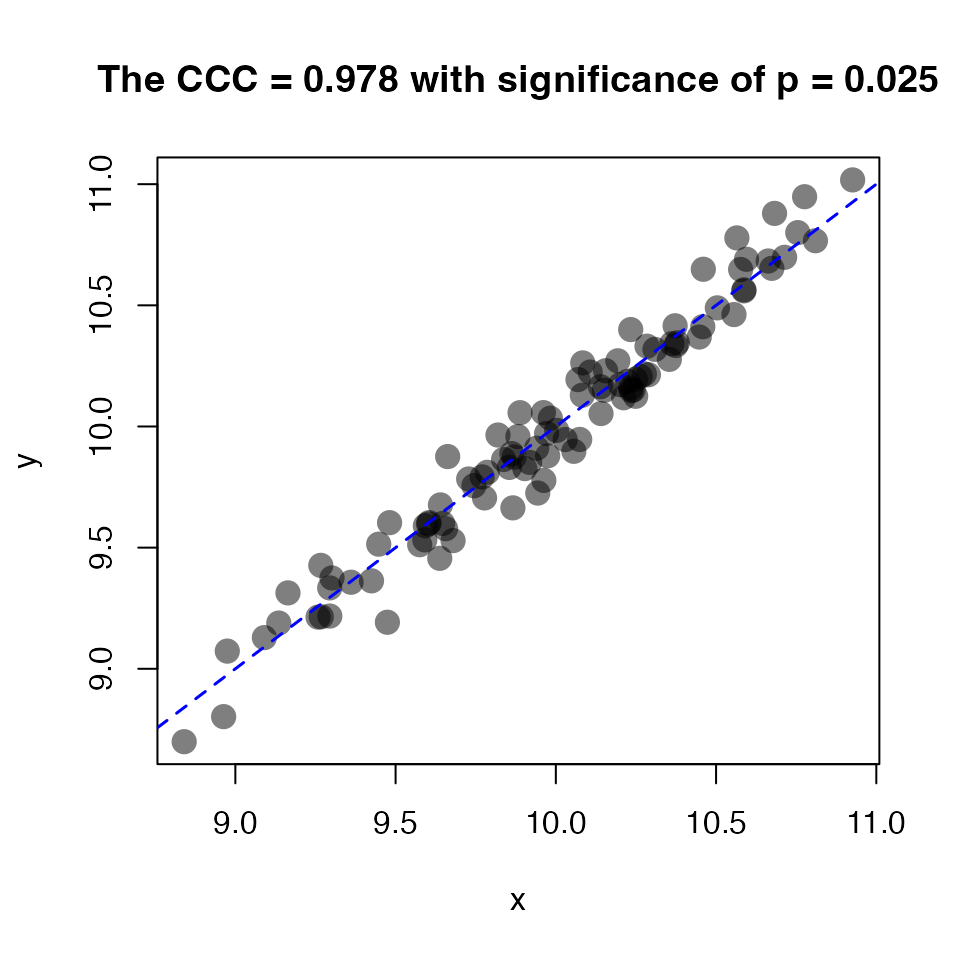
Calculate the ccc for two numeric vectors (visualize by
concordance):
x <- rnorm(100, mean = 10, sd = 0.5)
y <- x + rnorm(100, sd = 0.1)   # add random scatter
ccc <- calc_ccc(x, y)
plot(x, y, pch = 21, cex = 1.75, col = NA,
     bg = rgb(red = 0, green = 0, blue = 0, alpha = 0.5),   # black w alpha
     main = sprintf("The CCC = %0.3f with significance of p = %0.3f",
                    ccc$rho.c, ccc$p.value)
)
abline(0, 1, lty = 2, col = "blue", lwd = 1.5)
Concordance plot visualizing calc_ccc().
ccc
#> $rho.c
#> [1] 0.9778699
#>
#> $ci95
#>     lower     upper
#> 0.9675816 0.9849182
#>
#> $Z
#> [1] 2.24642
#>
#> $p.value
#> [1] 0.02467715
calc_ss()
Calculate the sum of squared differences for a numeric vector. Used ubiquotously in generating variances and standard deviations within other contexts (e.g. ANOVA, CVs):
is_monotonic()
is_monotonic(1:100)
#> [1] TRUE

is_monotonic(seq(-100, 100, by = 5))     # up
#> [1] TRUE

is_monotonic(seq(100, -100, by = -5))    # down
#> [1] TRUE

is_monotonic(rnorm(10))
#> [1] FALSE
is_logspace()
# A numeric vector
x <- rnorm(30, mean = 1000)
is_logspace(x)
#> [1] FALSE

is_logspace(log(x))
#> [1] TRUE
is_logspace(data) # FALSE

# log10-transform
for ( i in grep("^ft", names(data)) ) {
  data[[i]] <- log10(data[[i]])
}

is_logspace(data) # base 10; TRUE
diff_vecs()
diff_vecs(LETTERS[1:10L], LETTERS[5:15L], verbose = TRUE) # return invisible
#> ℹ Vectors differ by:
#> • Unique to LETTERS[1:10L] >> 4
#> • Unique to LETTERS[5:15L] >> 5
#> • Common Intersect         >> 6
#> • Union                    >> 15

(diff_vecs(LETTERS[1:10L], LETTERS[5:15L]))
#> $`unique_LETTERS[1:10L]`
#> [1] "A" "B" "C" "D"
#>
#> $`unique_LETTERS[5:15L]`
#> [1] "K" "L" "M" "N" "O"
#>
#> $inter
#> [1] "E" "F" "G" "H" "I" "J"
#>
#> $unique
#>  [1] "A" "B" "C" "D" "E" "F" "G" "H" "I" "J" "K" "L" "M" "N" "O"