Perform Progeny Clustering
progeny_cluster.RdDetermine the most stable (optimal) number of clusters via Progeny Clustering algorithm.
The is_pclust() function checks whether
an object is class pclust. See inherits().
Arguments
- data
A \(n \times p\) data matrix containing n samples and p features. Can also be a data frame where each row corresponds to a sample or observation, and each column corresponds to a feature or variable.
- clust_iter
integer(n). Span ofkclusters to interrogate over.- repeats
integer(1). The number of repeat iterations to perform. Particularly useful if error bars during plotting are desired.- r_seed
integer(1). Seed for the random number generator, for reproducibility.- ...
Important! Parameters passed to the internal
progeny_k(), i.e.n_iter =andsize =. Or, for theplot()method, arguments passed to the corresponding graphics device.- x
A
pclustclass object (or an object to be tested for one).
Value
A pclust class object, a list containing:
- scores
A matrix of stability scores for each iteration in a matrix, with
kcolumns- mean_scores
The mean stability scores for each cluster
k- ci95_scores
95% confidence interval scores
- random_scores
The reference (random) scores for each iteration at each clustering level (
k)- mean_random_scores
The mean of the reference (random) data set, i.e. column means of
random_scores- D_max
The distance between the mean stability scores and the mean reference scores for each cluster
k- D_gap
The "gap" distance metric for neighboring cluster k differences. See original paper for reference.
- clust_iter
Integer Sequence of
kclusters interrogated- repeats
The number of repeat iterations to performed
- n_iter
The number of progeny iterations to performed
- size
The progeny size used in each iteration
- call
The call made to
progeny_cluster()
is_pclust() returns a logical boolean.
References
Hu, CW, Kornblau, SM, Slater, JH and AA Qutub (2015). Progeny Clustering: A Method to Identify Biological Phenotypes. Scientific Reports, 5:12894. http://www.nature.com/articles/srep12894
See also
Other cluster:
stability_cluster()
Examples
# `n_iter =` and `size =` are passed to `progeny_k()`
pclust <- progeny_cluster(progeny_data, clust_iter = 2:9L,
n_iter = 20L, size = 6)
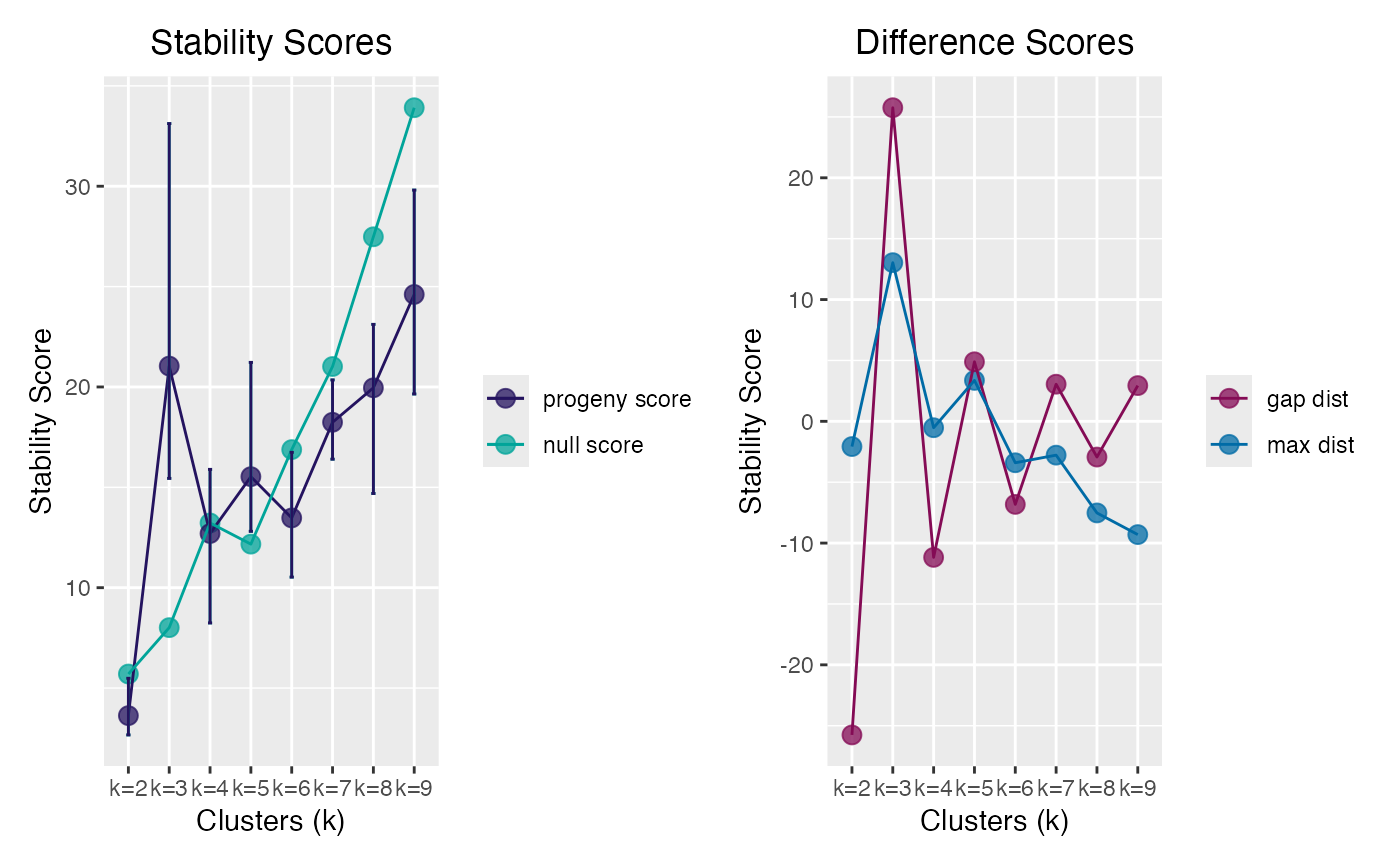
pclust
#> ══ Progeny Clustering ═════════════════════════════════════════════════
#> • Call 'progeny_cluster(data = progeny_data, clust_iter = 2:9L, n_iter = 20L, size = 6)'
#> • Progeny Size 6
#> • K iterations '2 → 9'
#> • No. iterations 20
#> • No. repeats 10
#>
#> ── Mean & CI95 Stability Scores ───────────────────────────────────────
#> k=2 k=3 k=4 k=5 k=6 k=7 k=8 ★k=9★
#> 2.5% 2.73 12.3 8.5 9.67 10.7 15.1 16.7 23.1
#> mean 3.79 23.3 11.2 13.63 12.0 18.3 20.0 27.3
#> 97.5% 4.88 36.9 13.4 16.99 13.9 26.0 23.0 30.8
#>
#> ── Maximum Distance Scores ────────────────────────────────────────────
#> k=2 ★k=3★ k=4 k=5 k=6 k=7 k=8 k=9
#> 1.004 16.700 3.295 3.544 0.382 3.670 3.215 8.484
#>
#> ── Gap Distance Scores ────────────────────────────────────────────────
#> k=2 ★k=3★ k=4 k=5 k=6 k=7 k=8 k=9
#> -31.55 31.55 -14.56 4.06 -7.81 4.45 -5.54 5.54
#> ═══════════════════════════════════════════════════════════════════════
# Test progeny clustering on iris data set
# Doesn't work as well as the simulated data set
clust_iris <- progeny_cluster(iris[, -5L], clust_iter = 2:5L,
size = 6L, n_iter = 250) # pass `...`
#> Warning: did not converge in 20 iterations
#> Warning: did not converge in 20 iterations
# true n_clusters = 3
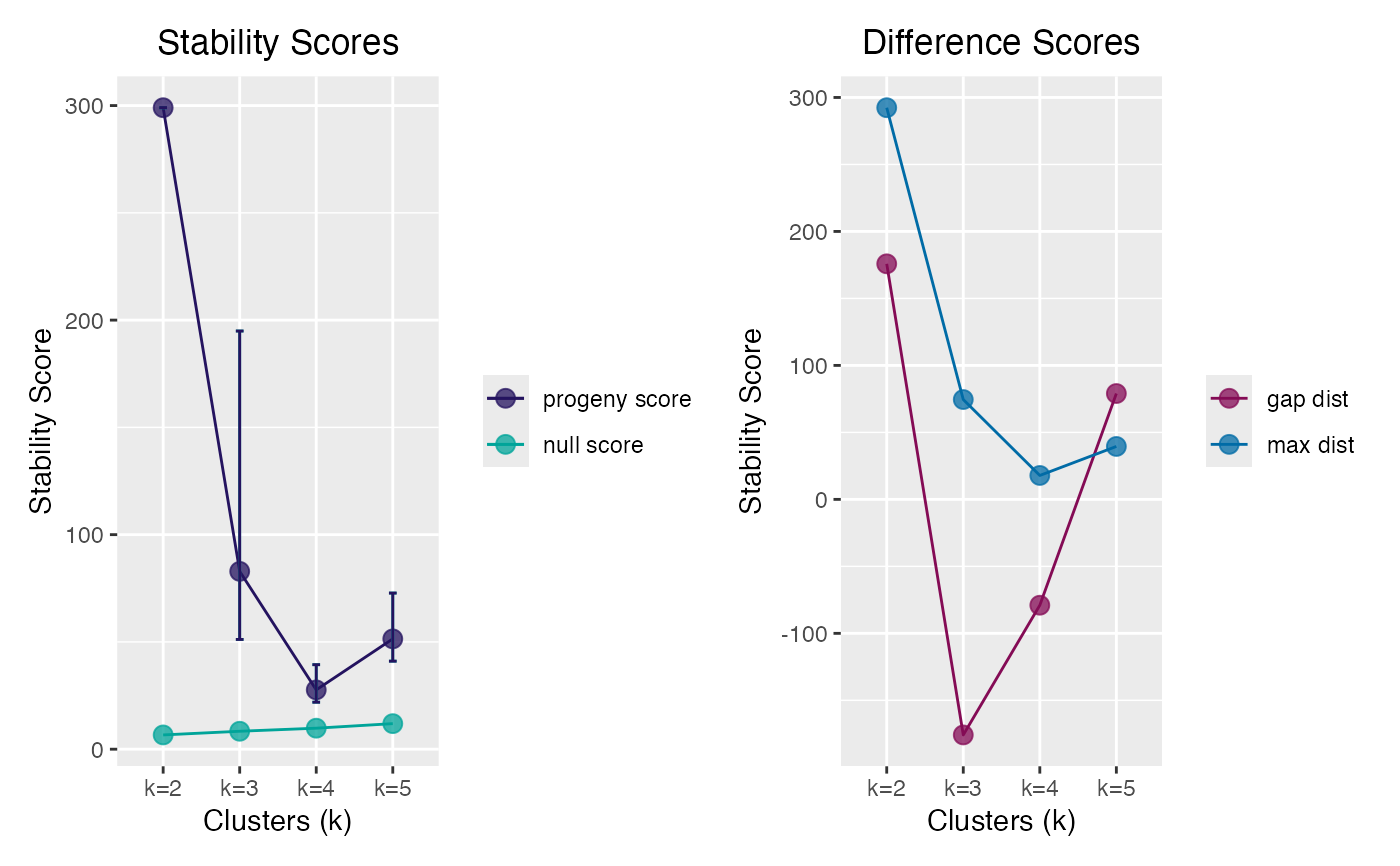
clust_iris
#> ══ Progeny Clustering ═════════════════════════════════════════════════
#> • Call 'progeny_cluster(data = iris[, -5L], clust_iter = 2:5L, size = 6L, n_iter = 250)'
#> • Progeny Size 6
#> • K iterations '2 → 5'
#> • No. iterations 250
#> • No. repeats 10
#>
#> ── Mean & CI95 Stability Scores ───────────────────────────────────────
#> ★k=2★ k=3 k=4 k=5
#> 2.5% 274 45.4 26.0 41.1
#> mean 874 59.7 28.3 46.7
#> 97.5% 1499 69.4 30.2 52.9
#>
#> ── Maximum Distance Scores ────────────────────────────────────────────
#> ★k=2★ k=3 k=4 k=5
#> 804.4 52.6 19.7 36.5
#>
#> ── Gap Distance Scores ────────────────────────────────────────────────
#> ★k=2★ k=3 k=4 k=5
#> 779.2 -779.2 -49.8 49.8
#> ═══════════════════════════════════════════════════════════════════════
# Test for class `pclust`
is_pclust(pclust)
#> [1] TRUE
# S3 plot method
plot(pclust)
 plot(clust_iris)