2-distribution (k2) Gaussian Mixture Model
normal_k2_mixture.RdEstimates the parameters of a 2 distribution mixture model via expectation maximization.
S3 plot method for "mix_k2" objects.
Arguments
- data
numeric(n).- pars
Initial values for
start_mu,start_sd, andstart_pi.- max_iter
integer(1). Max number of iterations to perform.- max_restarts
integer(1). Max number of restarts to perform.- eps
double(1). Machine precision for when to stop the algorithm.- x
A
mix_k2object generated fromnormal_k2_mixture.- type
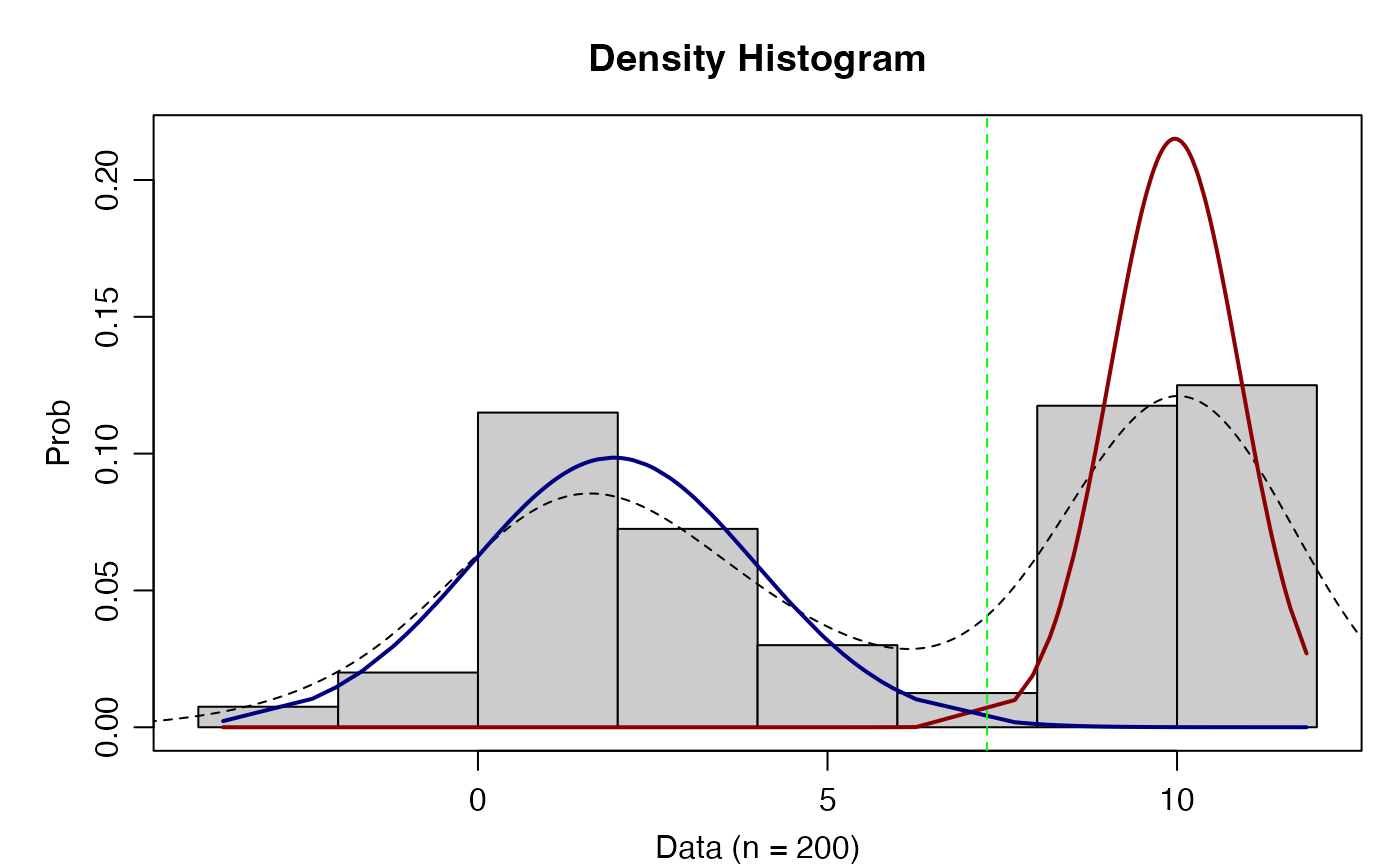
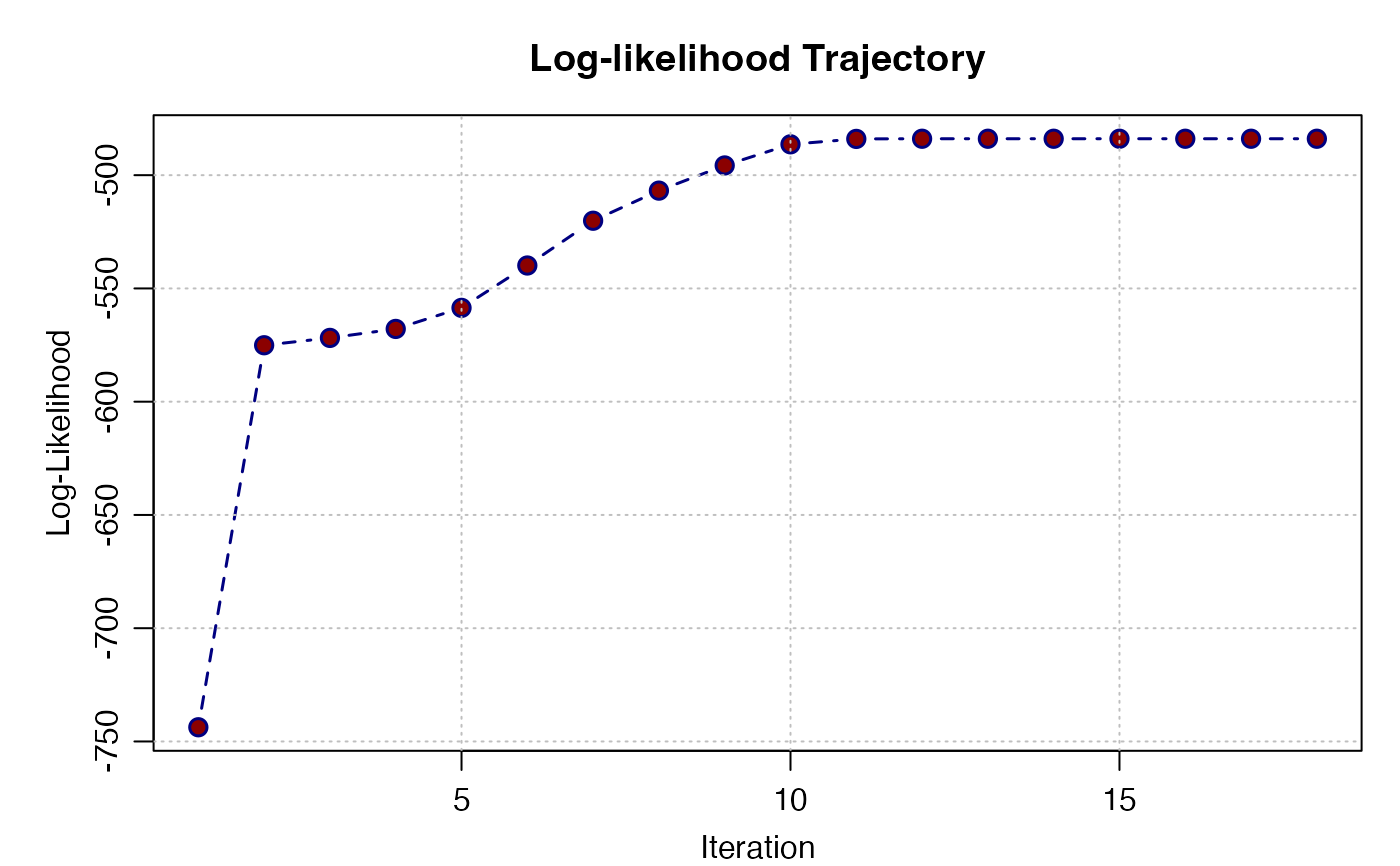
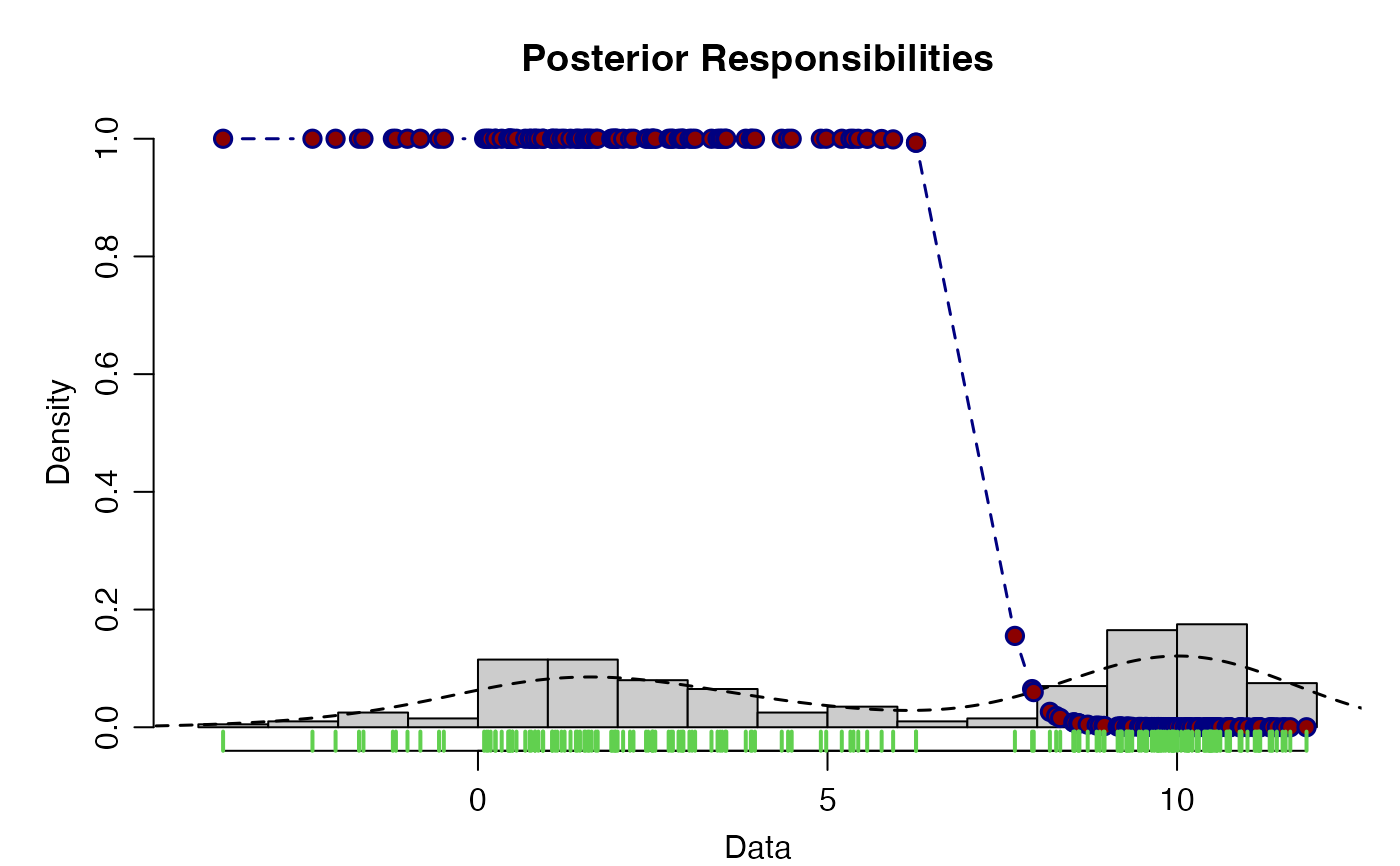
character(1). Matched string one of: "density", "likelihood" or "posterior".- title
character(1). Title for the plot.- ...
Additional parameters for extensibility.
Examples
# Generate 2 gaussian distributions
x <- withr::with_seed(101,
  c(rnorm(100, mean = 10, sd = 1), rnorm(100, mean = 2, sd = 2)))
mix_theta <- normal_k2_mixture(x)
#> ✓ Iteration ... 23
mix_theta
#> ══ Mix Type: normal_k2_mixture ═══════════════════════════════════════════
#> • n               200
#> • iter            23
#> • mu              [1.941, 9.97]
#> • sigma           [2.033, 0.924]
#> • pi_hat          0.498
#> • lambda          [0.502, 0.498]
#> • final loglik    -483.915
#> ══════════════════════════════════════════════════════════════════════════

plot(mix_theta)

plot(mix_theta, "like")

plot(mix_theta, "post")
