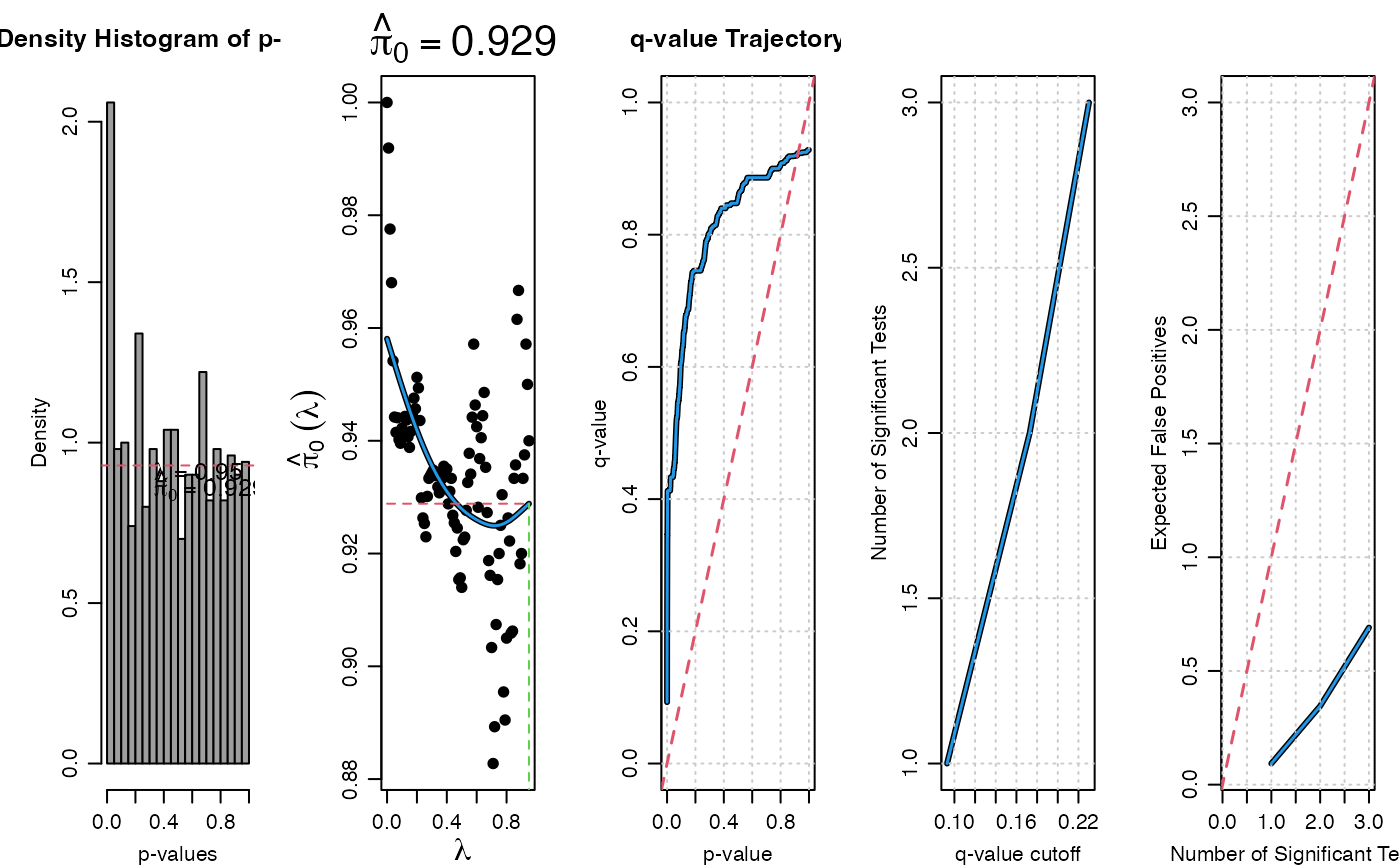
Calculate q-values
calc_qvalue.RdCalculates a vector of q-values corresponding to a vector of p-values.
Arguments
- p
A vector of p-values.
- lambda
A sequence of lambdas to evaluate.
- lambda_eval
A value of lambda to evaluate at, defaults to the maximum value of the
lambdasequence.- match_storey
logical(1). Should the output match theqvalue()function exactly?- x
A
q_valueclass object.- ...
Additional arguments passed to the S3 plot generic.
- rng
numeric(2). Range of values.
Value
A list of class q_value containing:
- call
The original call to
calc_qvalue().- p_value
The original vector of p-values.
- m
?
- lambda
?
- lambda_eval
?
- pi_lambda
?
- spline_fit
?
- pi0
?
- q_value
A a vector of q-values.
A cool plot.
