Plot a ROC with CI95
plot_boot_roc.RdPlots a ROC curve with bootstrapped 95% confidence interval boundary overlay.
Usage
plot_boot_roc(
  truth,
  predicted,
  pos_class,
  shade_color = "black",
  nboot = 1000,
  r_seed = 101,
  add = FALSE,
  ...
)
Arguments
- truth
character(n)orfactor(n). A vector of true class names. In most instances you will have to also pass apos_classargument defining the positive/event class.- predicted
numeric(n). A numeric vector of class probabilities.- pos_class
character(1). Name of the "positive" or "event" class.- shade_color
The color for the bootstrap shaded region. Passed as a
fillargument to downstreamggplot2machinery.- nboot
integer(1). The number of bootstrap estimates to perform.- r_seed
`integer(1). The value of the random seed if reproducibility is desired.
- add
Logical. Should a plotting layer be added to an existing plot?
- ...
Additional arguments passed to
geom_roc(), e.g.color =.
See also
Other ROC:
calc_roc_fit(),
create_roc_data(),
geom_roc(),
plot_emp_roc(),
roc_xy()
Examples
n <- 75
true <- rep(c("control", "disease"), each = n)
pred <- withr::with_seed(1, c(rnorm(n, 0.2, 0.3), rnorm(n, 0.8, 0.3)))
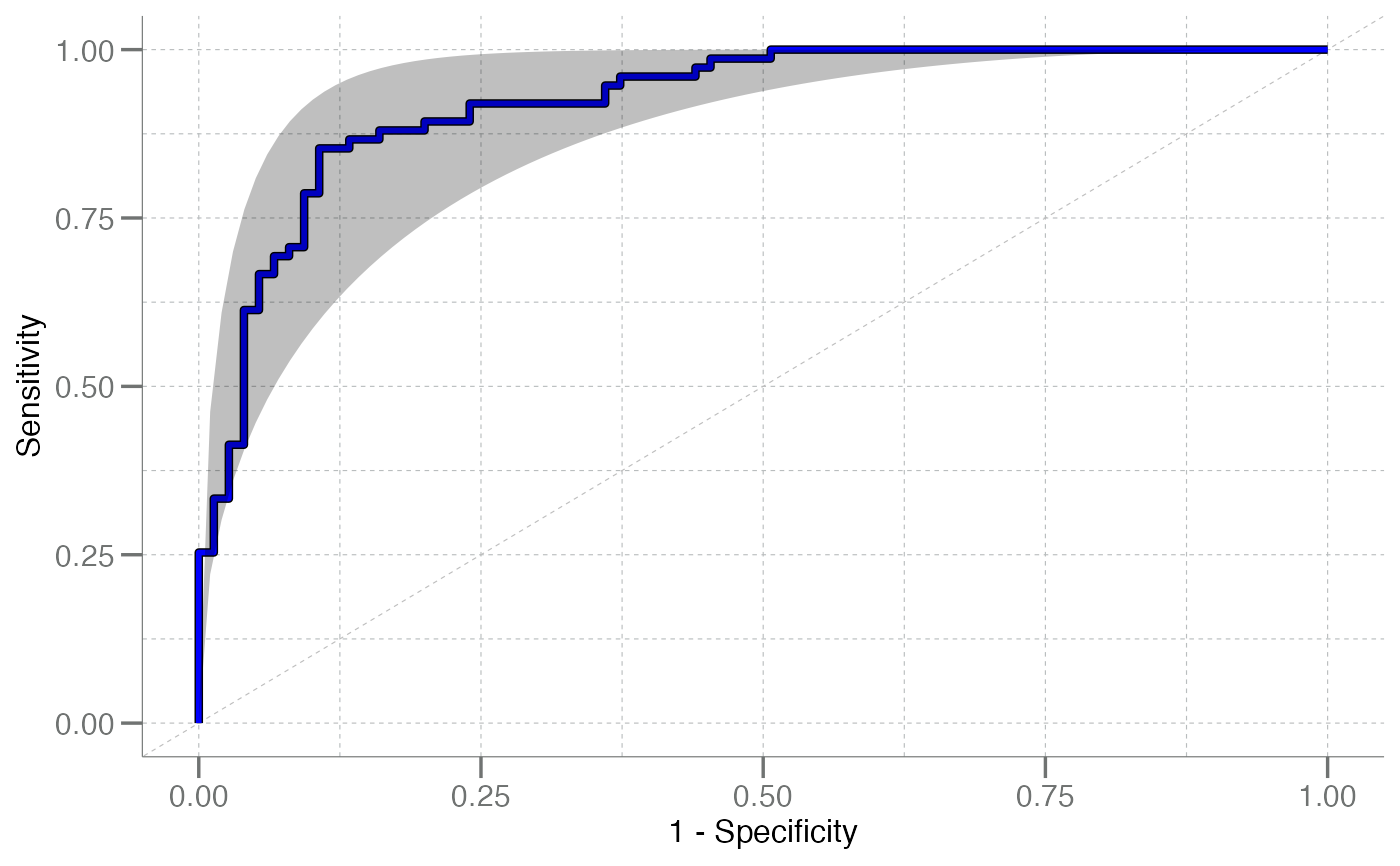
plot_boot_roc(true, pred, pos_class = "disease", nboot = 200, color = "blue")
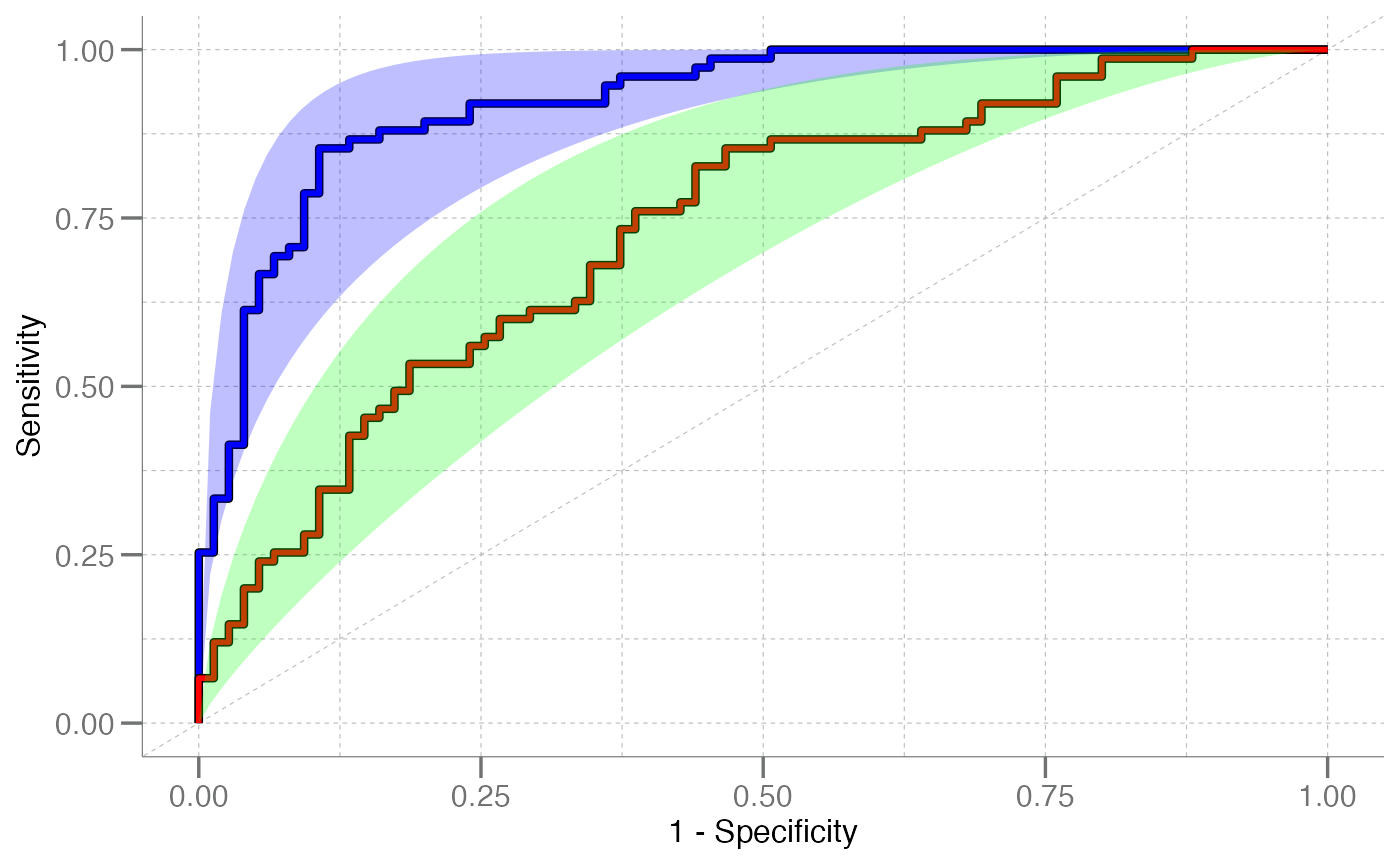
 # add layer
pred2 <- withr::with_seed(1, c(rnorm(n, 0.2, 0.3), rnorm(n, 0.5, 0.3)))
plot_boot_roc(true, pred, pos_class = "disease", nboot = 200,
shade_color = "blue", color = "blue") +
plot_boot_roc(true, pred2, pos_class = "disease", nboot = 200,
shade_color = "green", color = "red", add = TRUE)
# add layer
pred2 <- withr::with_seed(1, c(rnorm(n, 0.2, 0.3), rnorm(n, 0.5, 0.3)))
plot_boot_roc(true, pred, pos_class = "disease", nboot = 200,
shade_color = "blue", color = "blue") +
plot_boot_roc(true, pred2, pos_class = "disease", nboot = 200,
shade_color = "green", color = "red", add = TRUE)