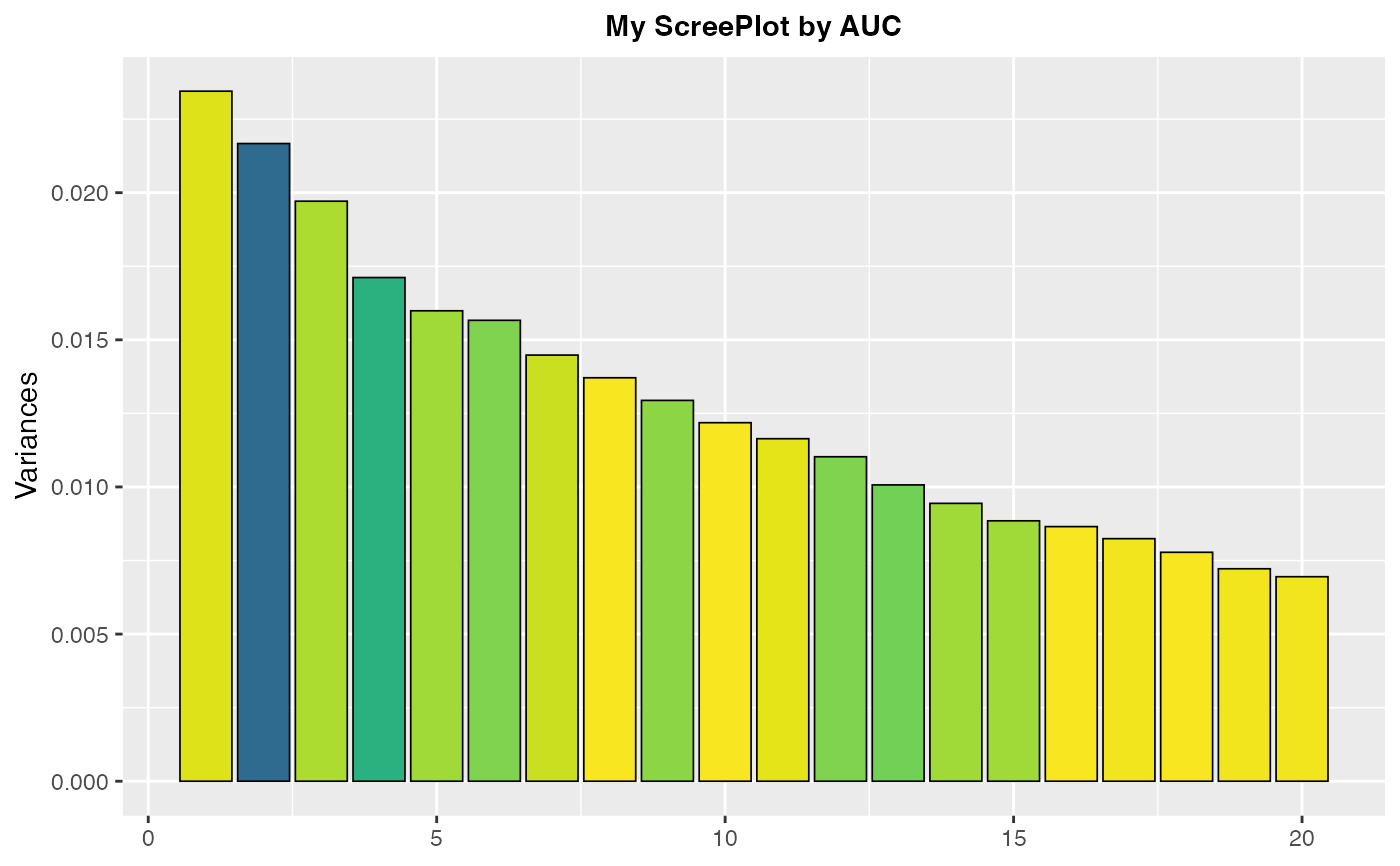
Plot AUC Dependent Screeplot
screeplot_auc.RdPlot a screeplot with the variance bars colored according to the AUC of the corresponding classes in a specified training response vector.
Arguments
- data.prcomp
A prcomp class object. Typically the object returned by
prcomp2().- auc.classes
A vector of the training classes used in calculating the AUC.
- auc.proj
An alternative projection matrix from another decomposition. By default, the projection from
data.prcompis used.- main
character(1). A string containing the title for the plot.- nPCs
integer(1). Number of PCs to plot.- ...
Additional arguments passed to
geom_col().
See also
Other PCA plots:
plot_pca_dims(),
plot_projection(),
plot_rotation()
Examples
pca <- center_scale(pcapkg:::log10_ft(simdata), center = TRUE, scale = FALSE) |>
  feature_matrix() |>
  prcomp2()
screeplot_auc(pca, simdata$class_response, main = "My ScreePlot by AUC")