Plot A PCA Dimension
plot_pca_dims.RdPlots either the projection or the loadings (rotation) of
"prcomp" object. This is a base function that is
wrapped into driver parent functions in the plotting of
principal components, most notably plot_rotation()
and plot_projection().
Usage
plot_pca_dims(
  data.prcomp,
  value = c(NA, "rotation", "x"),
  dims,
  classes,
  main = sprintf("PCA Plot (%s)", ifelse(value == "x", "projection", value)),
  scores = NULL,
  col = NULL,
  xlab = NULL,
  ylab = NULL,
  legend_pos = "right",
  xlim = NULL,
  ylim = NULL,
  pt_cex = 2.5,
  pt_pch = 19,
  add_ellipse = FALSE,
  ...
)
Arguments
- data.prcomp
A prcomp class object. Typically the object returned by
prcomp2().- value
Character. The type of plot to be generated. For projection enter "x", for rotation enter "rotation".
- dims
integer(2). Which dimensions to plot.- classes
Optional. A vector indicating the classes of observations (either features or samples) used for coloring the points, depending on whether a rotation or a projection is to be plotted. Must be the same length as the plot type, i.e. number of samples for projection and features for rotation.
- main
character(1). A string containing the title for the plot.- scores
Optional. Statistical scores to pass through for the coloring of the points during plotting. If a training data set is passed and
scores = NULL, then KS-distances (scores) will be calculated under the hood and used to determine point color. Can be either a single value (e.g. "red") or a vector of color values the same length as the number of observations. This overrides the point color assigned byclassesabove.- col
character(1). The color of the points. Can be either a single value (e.g. "red") or a vector of color values the same length as the number of observations. This parameter overrides the point colors determined by both theclassesandscoresparameters above.- xlab
character(1). A string indicating the label of the x axis.- ylab
character(1). A string indicating the label of the y axis.- legend_pos
character(1). Position of the legend, if plotted. Options include "left", "right", "bottom", or "top", or "none" if no legend is desired. Ignored ifvalue = "r"(rotation) and classes are not specified.- xlim
numeric(2). Optional limits for the x-axis in the formatc(0, 0).- ylim
Numeric. Optional limits for the y-axis in the format
c(0, 0).- pt_cex
numeric(1). Character expansion for the points.- pt_pch
numeric(1). Shape of the points. Accepted values are 0-25.- add_ellipse
Logical. Should an ellipse be added to the rotation? Ignored if projection (
value = "x").- ...
Additional arguments passed to
geom_point().
See also
Other PCA plots:
plot_projection(),
plot_rotation(),
screeplot_auc()
Examples
# Prepare data
pca <- center_scale(pcapkg:::log10_ft(simdata), center = TRUE, scale = FALSE) |>
feature_matrix() |>
prcomp2()
scores <- withr::with_seed(101, rnorm(40))
# Rotation space, with scores to define point colors
plot_pca_dims(pca, value = "r", dims = 1:2L, classes = NULL,
scores = rnorm(40))
 # Projection space, with classes to define point colors
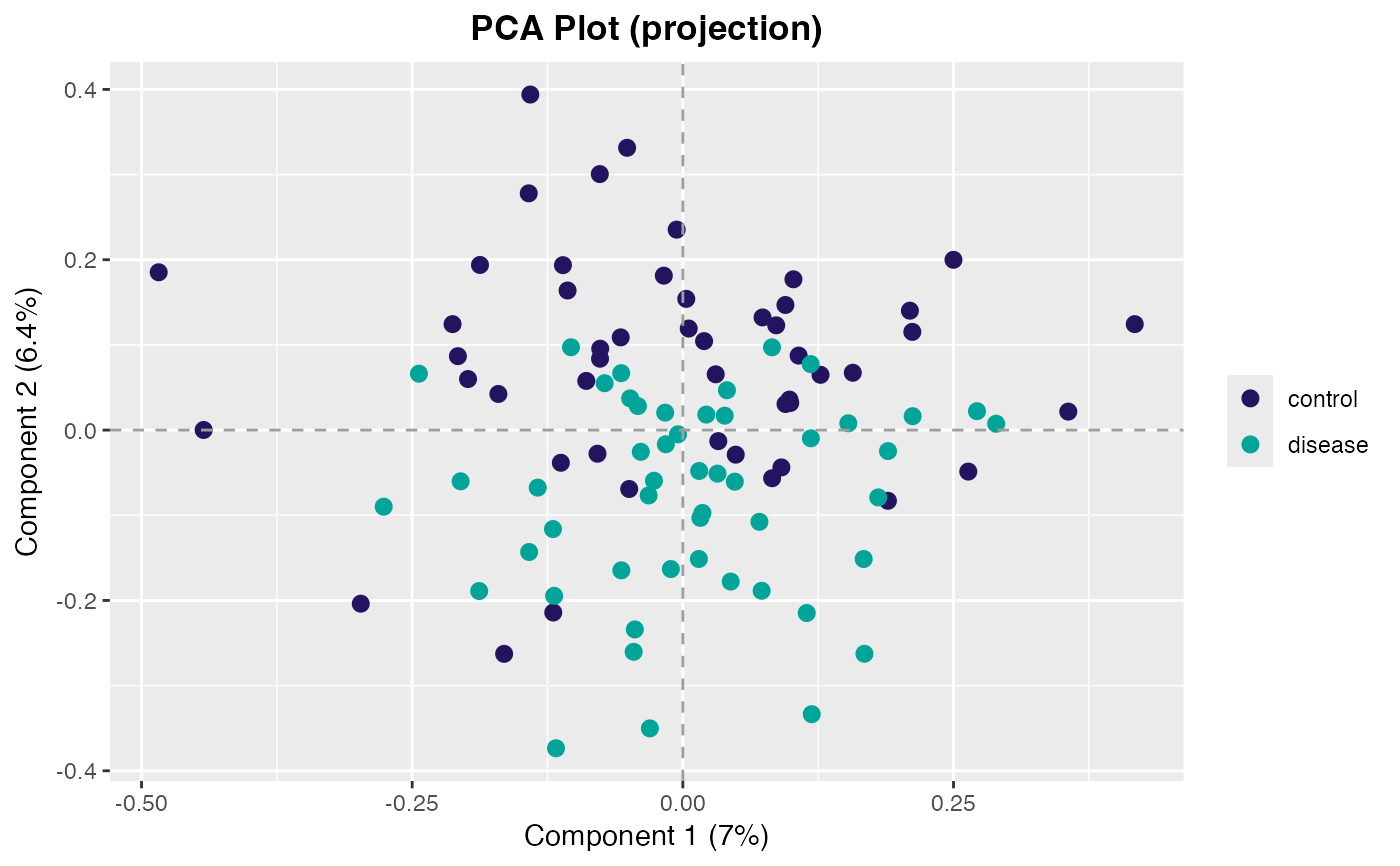
plot_pca_dims(pca, value = "x", dims = 1:2L,
classes = simdata$class_response)
# Projection space, with classes to define point colors
plot_pca_dims(pca, value = "x", dims = 1:2L,
classes = simdata$class_response)