Create Manhattan Plot
plot_manhattan.RdCreates a Manhattan plot of the differences or log-ratios of the training set for each feature.
Usage
plot_manhattan(
  data,
  x.lab = "Feature",
  type = c("t.test", "log2fc", "ks.test"),
  as_pvalue = FALSE
)Examples
tr <- create_train(simdata,
class_response %in% c("control", "disease"),
group_var = class_response,
classes = c("control", "disease"))
# Various options for plotting
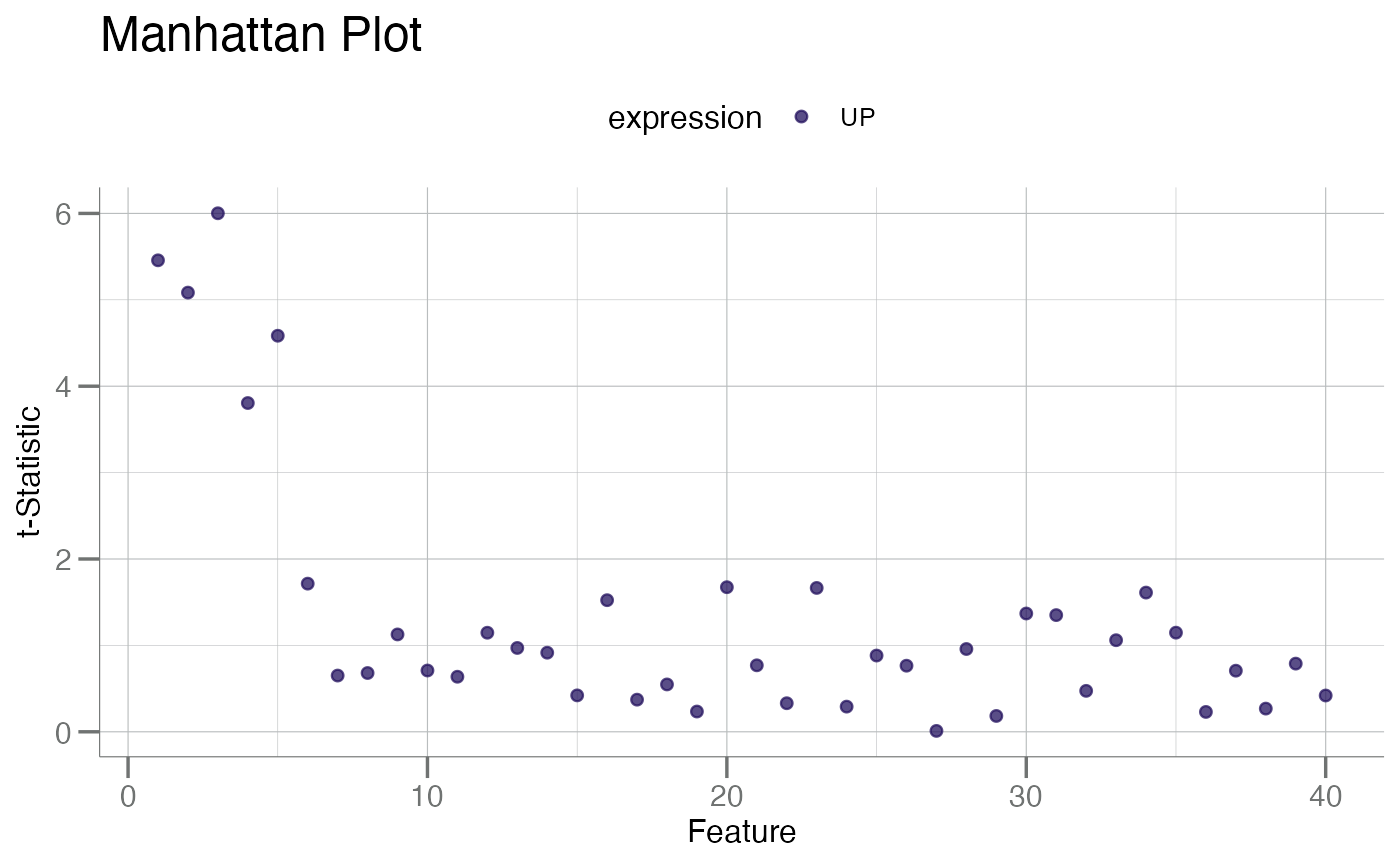
plot_manhattan(tr, type = "t")
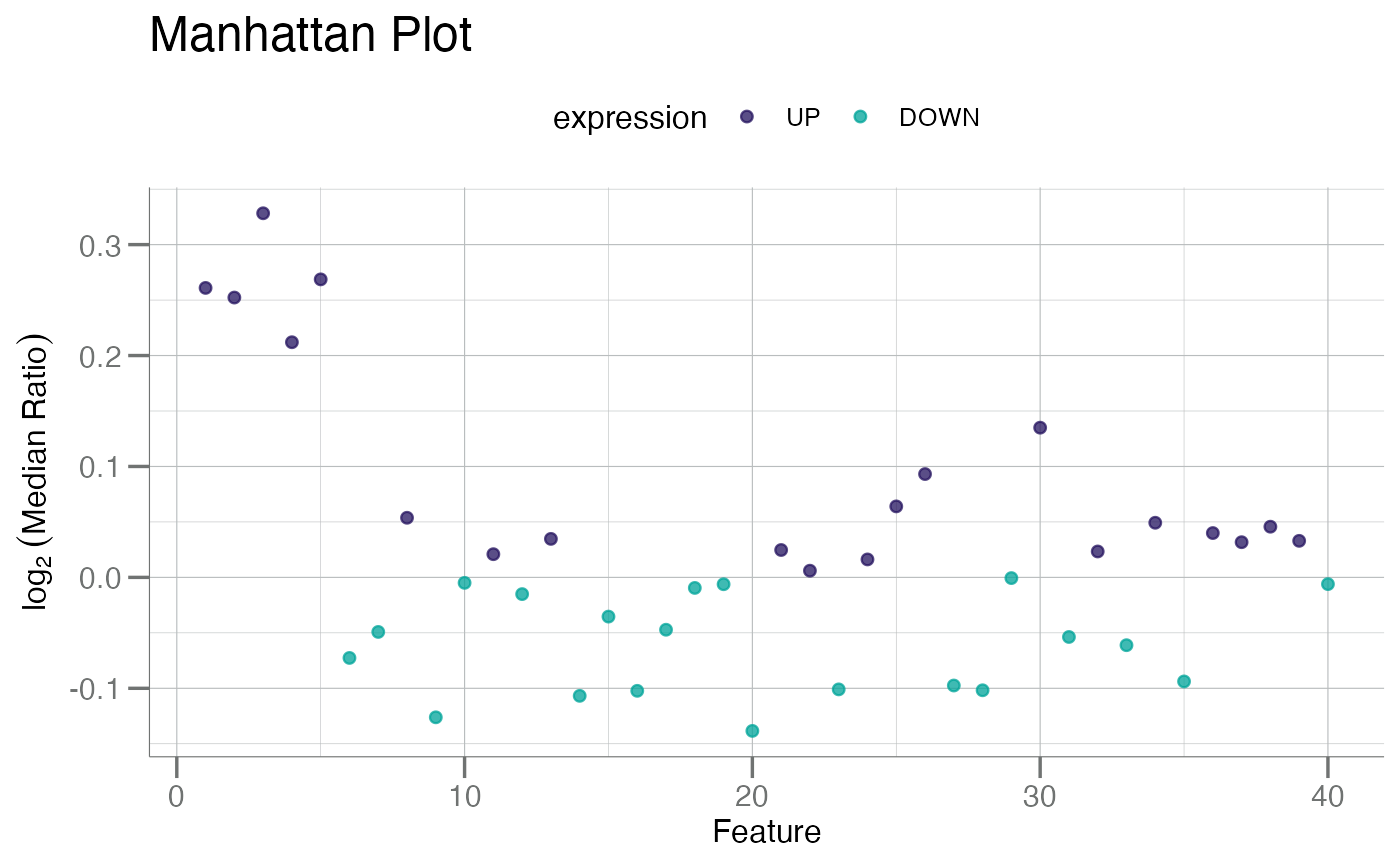
 plot_manhattan(tr, type = "log2")
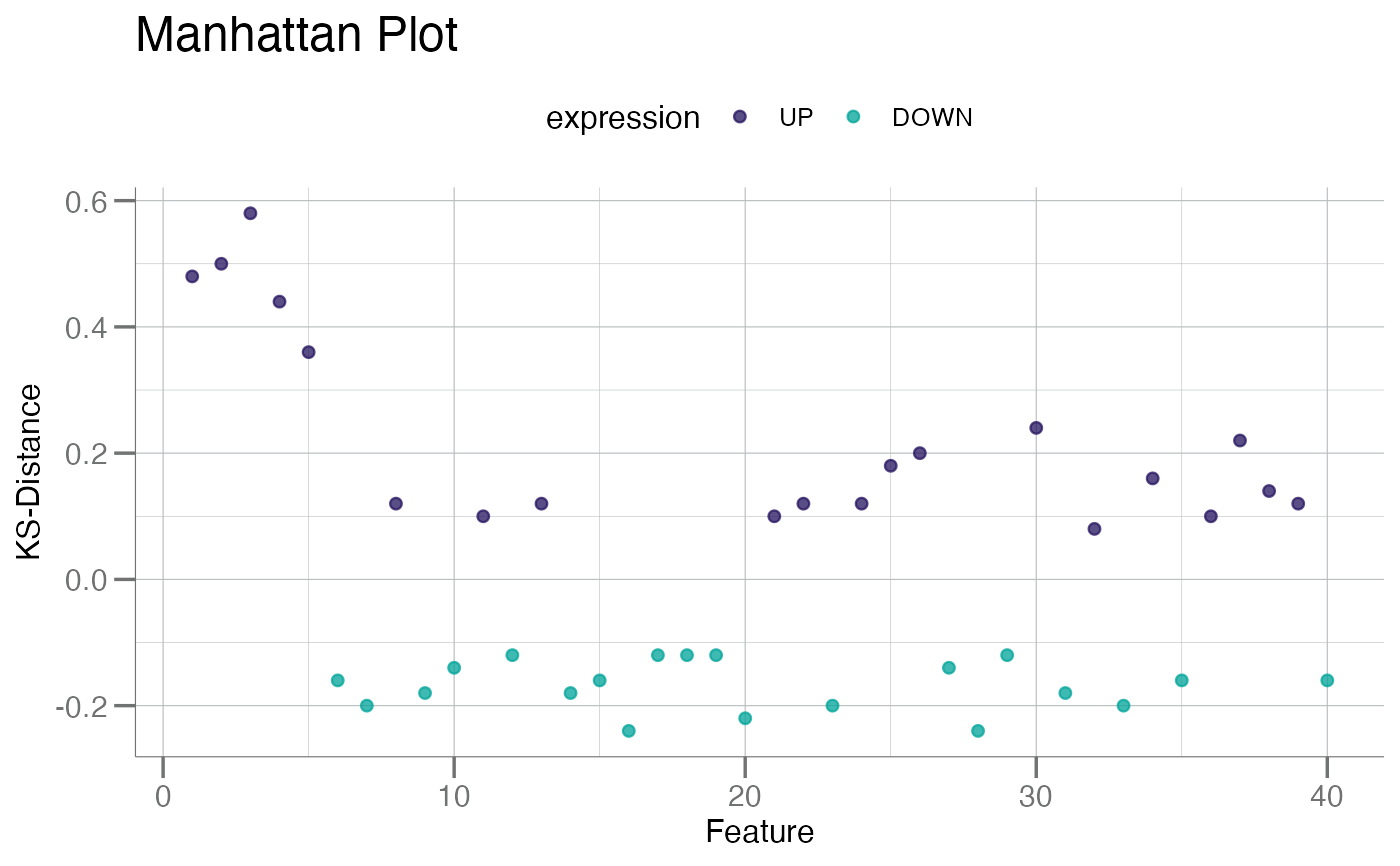
 plot_manhattan(tr, type = "ks")
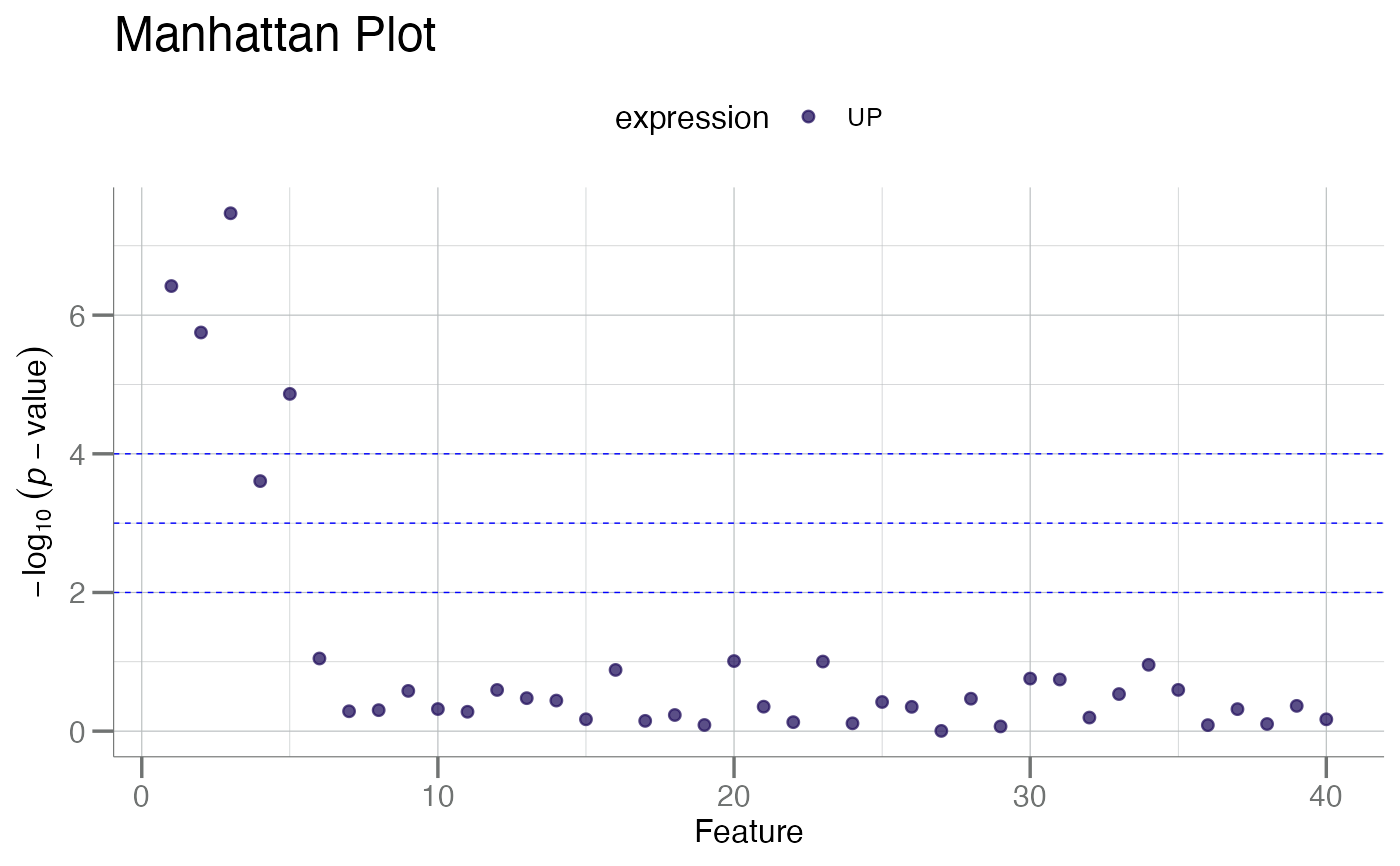
 plot_manhattan(tr, type = "t", as_pvalue = TRUE)