Create a Log-Odds Plot
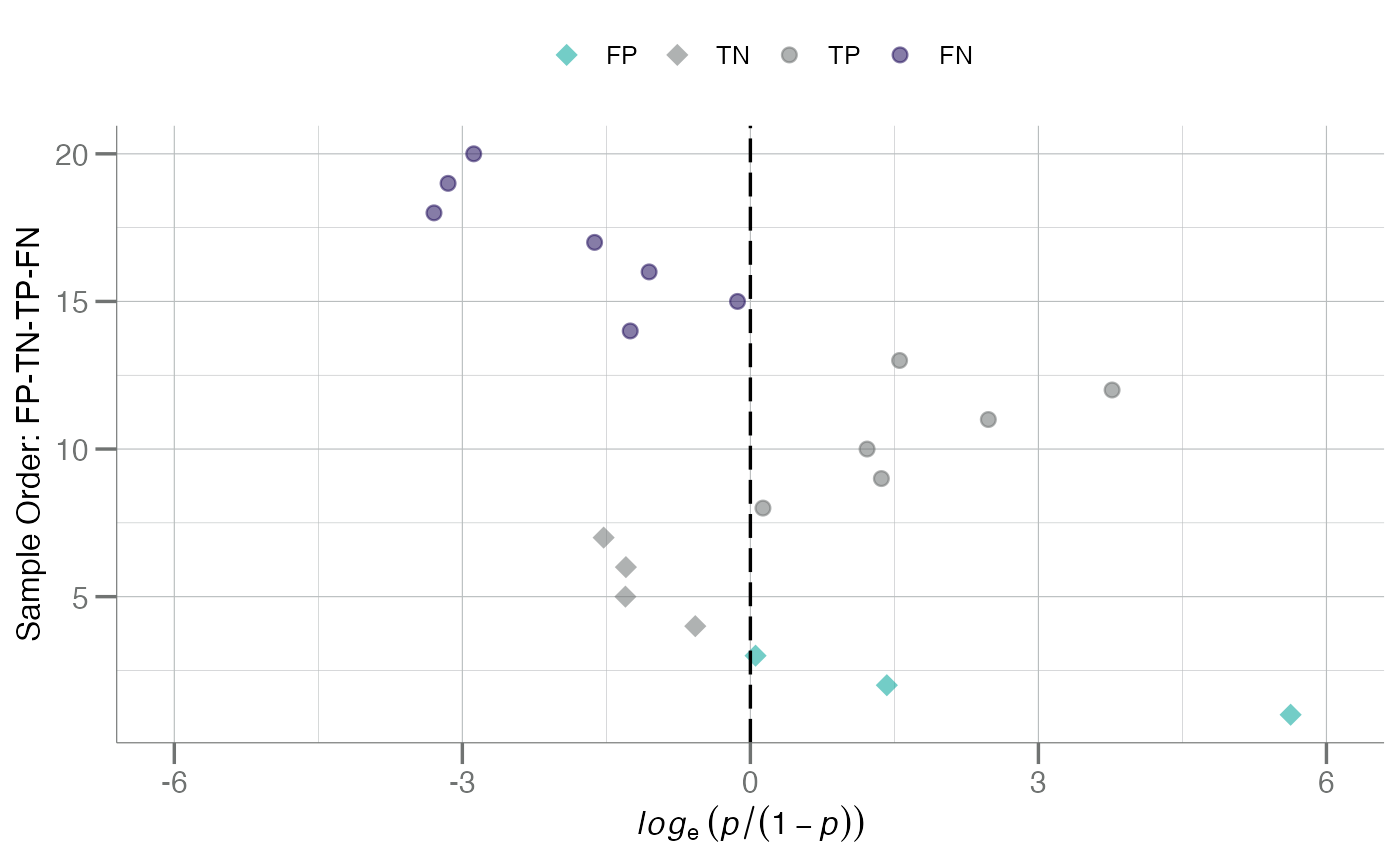
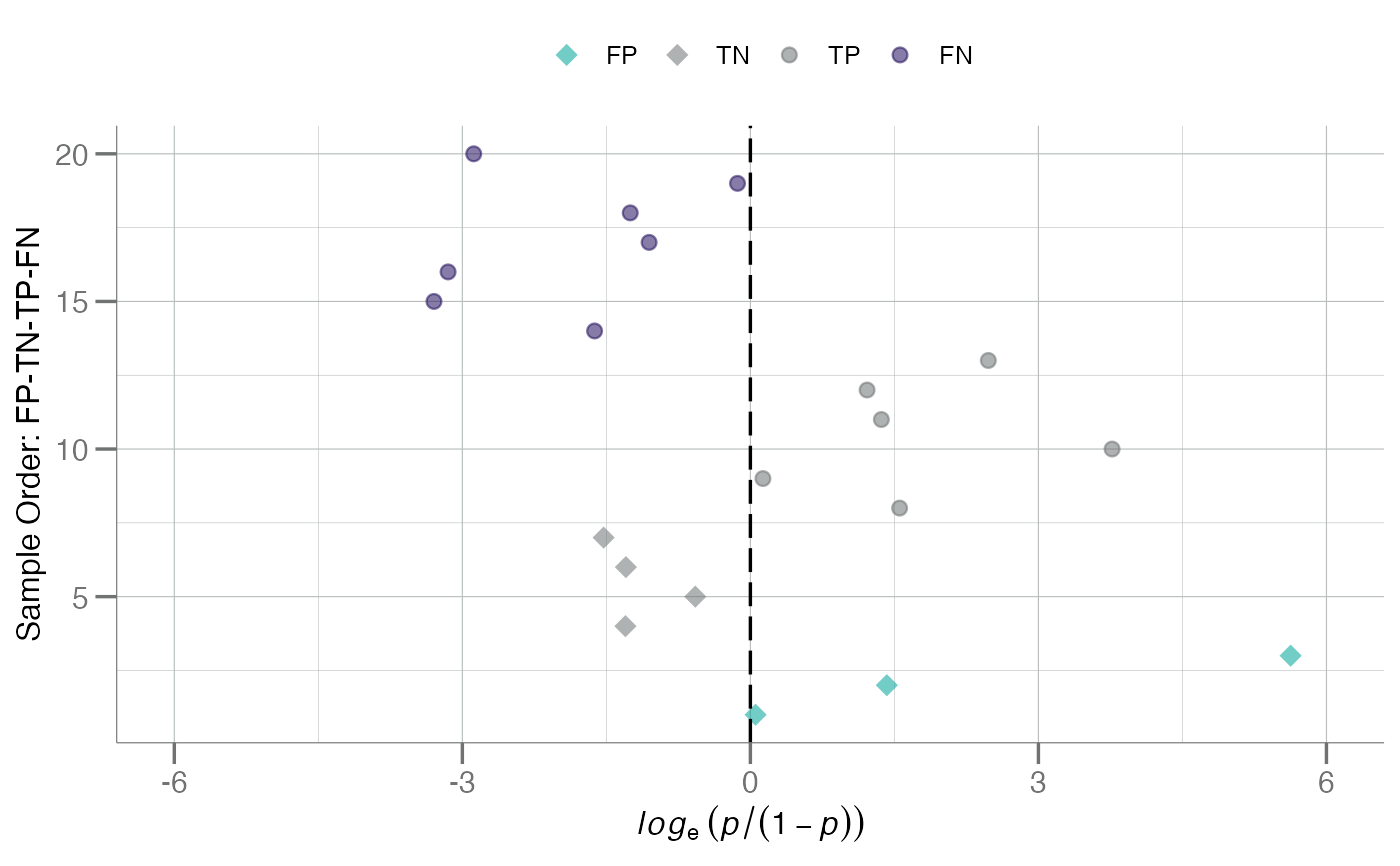
plot_log_odds.RdPlot the log-odds, $$log(Prob / (1 - Prob))$$ for each sample.
See Section for note about extreme probabilities.
Usage
plot_log_odds(
  truth,
  predicted,
  pos_class,
  cutoff = 0.5,
  y_lab = NULL,
  max_prob = NULL,
  scramble = FALSE
)
Arguments
- truth
character(n)orfactor(n). A vector of true class names. In most instances you will have to also pass apos_classargument defining the positive/event class.- predicted
numeric(n). A numeric vector of class probabilities.- pos_class
character(1). Name of the "positive" or "event" class.- cutoff
numeric(1). A cutoff for the decision/operating point, predictions above which are considered the positive class.- y_lab
character(1). Optional label for the y-axis.- max_prob
numeric(1). Experimental. Maximum probability value cutoff for the log-odds plot. Removes extreme samples from the plot to avoid distorting x-axis.- scramble
logical(1). Should values be randomized to avoid monotonically decreasing probability scores (aesthetic)?