Add a Sensitivity/Specificity Box
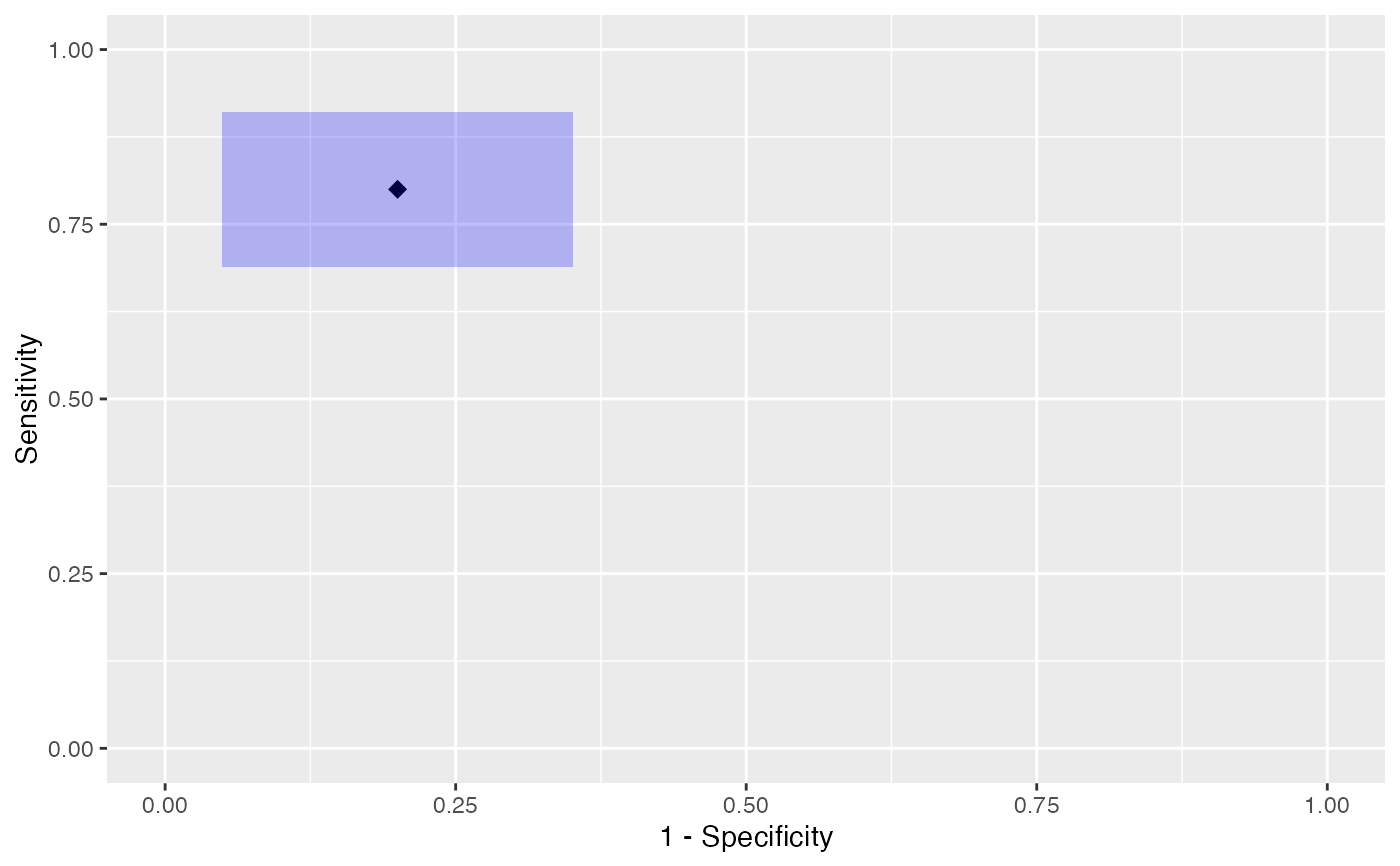
add_ss_box.RdAdd a shaded box, typically to a ROC curve, that corresponds to the 95% joint binomial confidence interval of the sensitivity and specificity.
Calculate the joint 95% confidence interval given sensitivity and specificity.
Arguments
- x
A
2x2data frame ortibblecontaining the lower and upper CI95 joint confidence limits for sensitivity and specificity. A call tocalc_joint_CI95()generates values in this specified format.- col
character(1)orinteger(1). Specify the colors for lines, points, bar, box, or ROC.- alpha
numeric(1)in[0, 1]. The color transparency. See alsoggplot2::alpha().- sens
numeric(n). The sensitivity: \([0, 1]\).- spec
numeric(n). The specificity: \([0, 1]\).- n.controls
integer(1). Number of control or non-cases.- n.cases
integer(1). Number of cases/disease.
Value
A \(2x2\) matrix containing rows of sensitivity and specificity respectively and columns of lower and upper 95% joint confidence intervals respectively.
Details
Recall that the ROC curve is 1 - specificity, therefore the
added box involves internally inverting the specificity limits
so that the interval matches the plot.
Examples
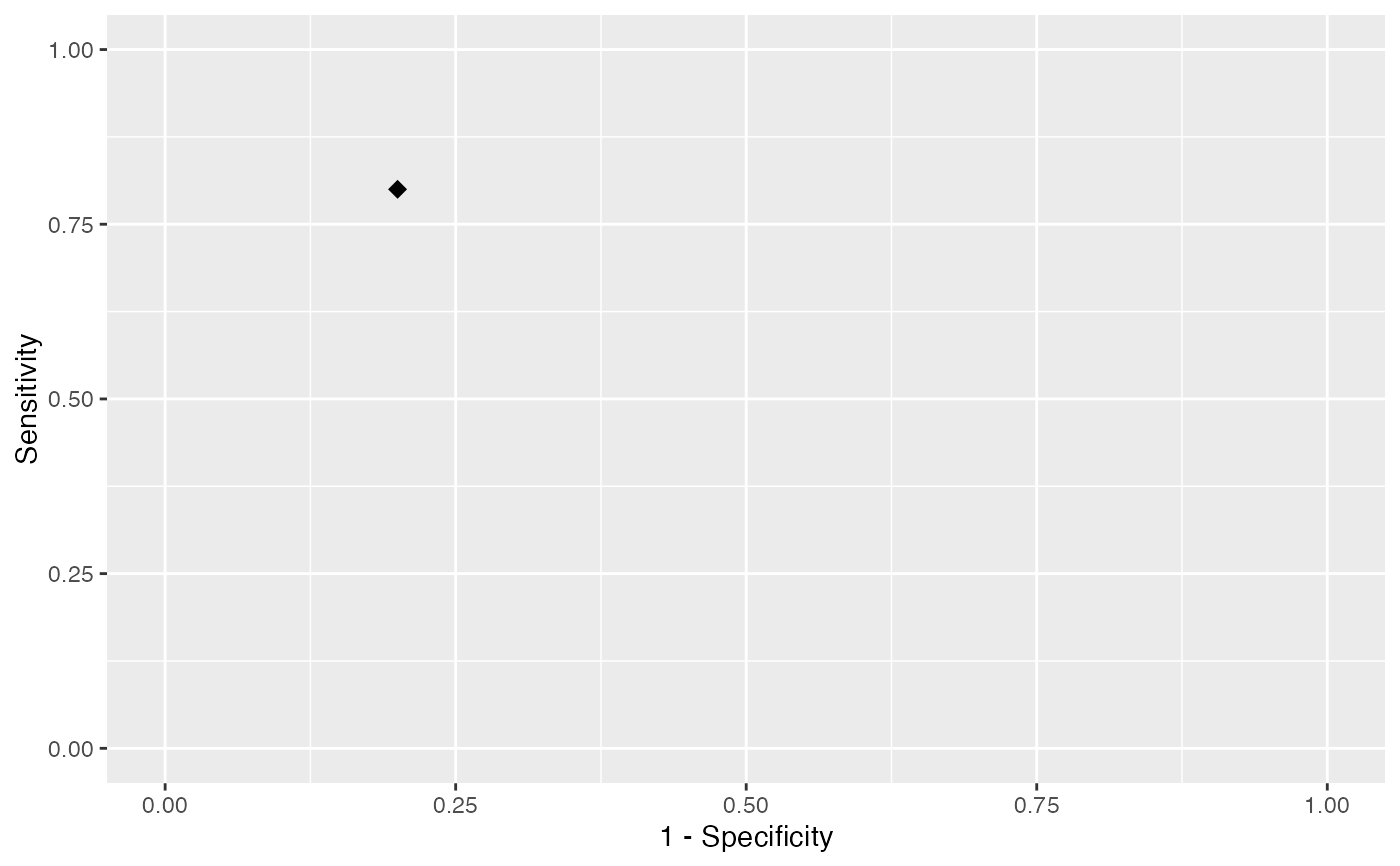
g <- ggplot2::ggplot(data.frame(x = 0.2, y = 0.8), ggplot2::aes(x = x, y = y)) +
ggplot2::geom_point(shape = 18, size = 3) +
ggplot2::lims(x = 0:1, y = 0:1) +
ggplot2::labs(y = "Sensitivity", x = "1 - Specificity")
g
 # calculate CI95s for 80/80 sens/spec
ci95 <- calc_joint_CI95(0.8, 0.8, 35, 65)
ci95
#> # A tibble: 2 × 2
#> lower upper
#> * <dbl> <dbl>
#> 1 0.689 0.911
#> 2 0.649 0.951
# unequal box due to class imbalance (65/35)
g + add_ss_box(ci95, col = "blue", alpha = 0.25)
# calculate CI95s for 80/80 sens/spec
ci95 <- calc_joint_CI95(0.8, 0.8, 35, 65)
ci95
#> # A tibble: 2 × 2
#> lower upper
#> * <dbl> <dbl>
#> 1 0.689 0.911
#> 2 0.649 0.951
# unequal box due to class imbalance (65/35)
g + add_ss_box(ci95, col = "blue", alpha = 0.25)